You know how trading in financial markets is all about catching those waves, right? It’s the same with binary options. But here's the deal—most traders struggle when it comes to identifying trends and reversals. The market can feel like an endless sea, and prices can drop just like crashing waves.
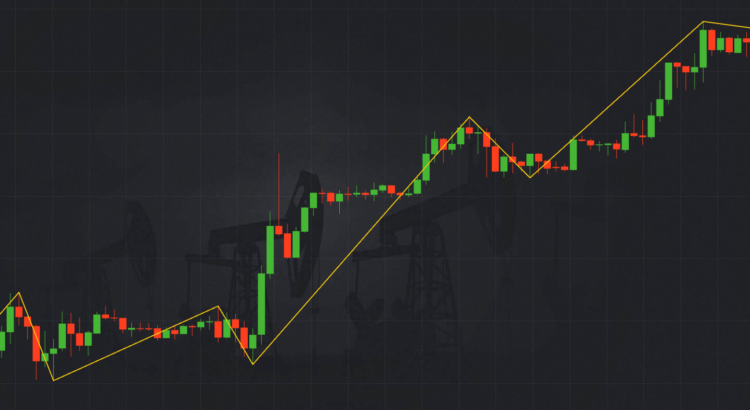
One of my go-to strategies is using the Zig-Zag indicator to pinpoint those high and low prices. This tool helps me outline the trend and capture the overall movement. I’ve seen it on many platforms, but I’m a fan of the Pocket Option Broker. So here’s the lowdown: the Zig-Zag indicator marks points on your chart whenever prices change by a specified percentage. Then, it connects those points with straight lines, helping me keep track of price trends. It's like a filter for that annoying market noise, showing me clear trends across all time frames.
The external appearance and settings of the indicator
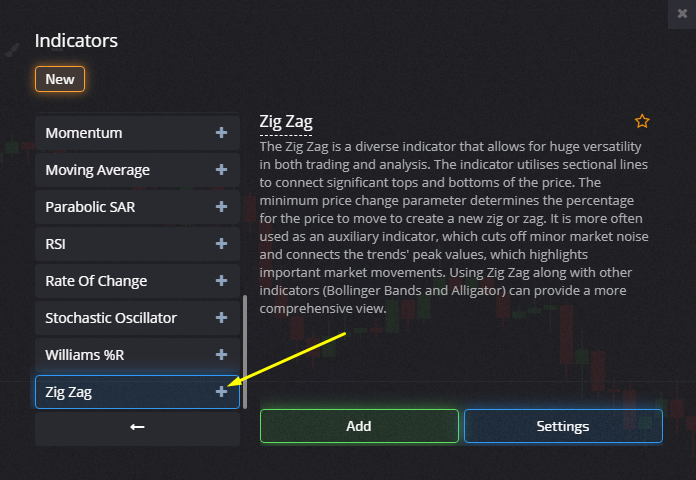
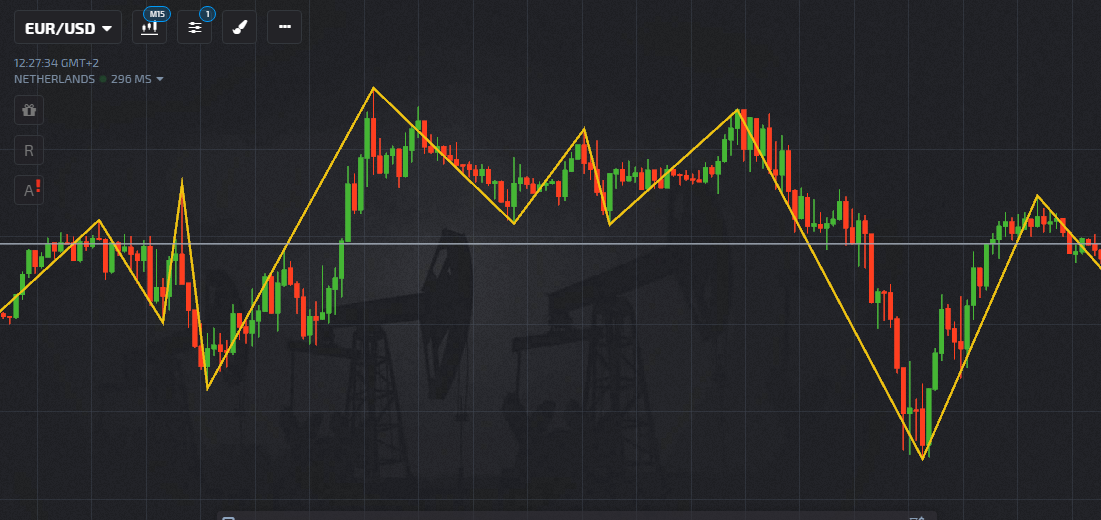
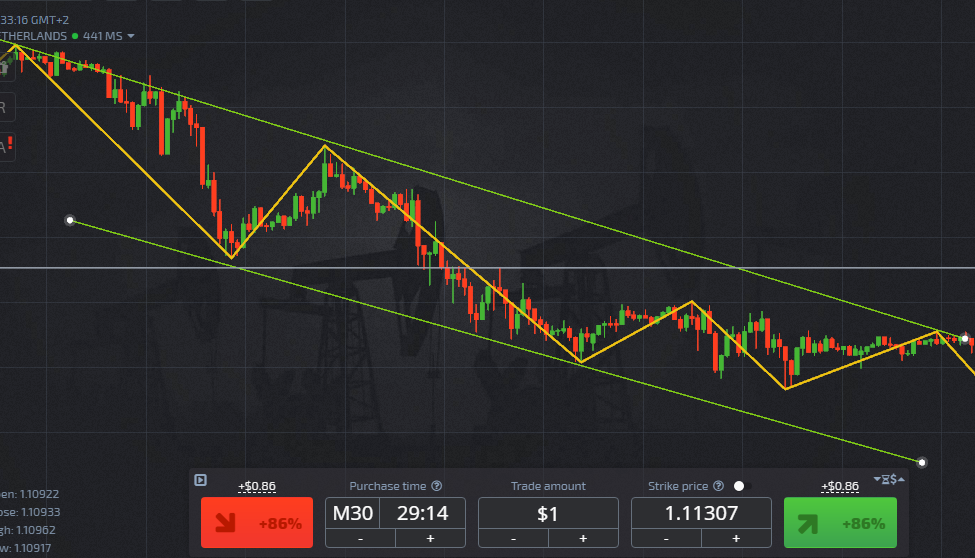
You’ll find the Zig-Zag right on your price chart.
Just head to the Menu under Indicators on Pocket Option and grab it. I usually stick with my settings or just go for the recommended ones.
Check out the “broken line” on your chart; those angles align with the peaks of price swings. The Zig-Zag doesn’t pay attention to those tiny price changes that are simply noise.
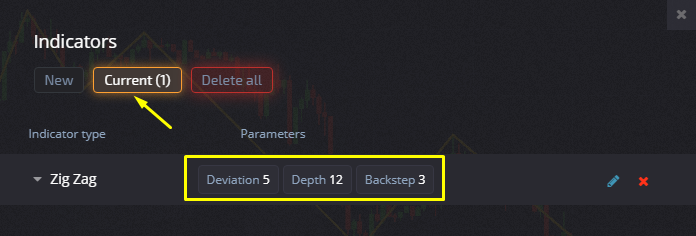
Now, let’s break down the Zig-Zag settings. It typically comes with two parameters: Deviation and Depth.
I usually set Deviation to 5—pretty standard stuff in the terminal.
Then, I adjust the Depth based on my chosen time frame.
For quick trades, I set it to 12, for medium trades I’ll use 10, but for long-term? 6 or 8 is the sweet spot.
How To Use the Zig-Zag Indicator in Trading
Even though the Zig-Zag Indicator is pretty slick, it ain't a magic solution for finding perfect entry points. It doesn't cross anything or give out any signals besides those zigzags.
But trust me, it’s a fantastic tool for understanding market direction and spotting potential reversals.
I highly recommend using the Zig-Zag Indicator for:
- Drawing trend lines and identifying the price channel.
Draw lines connecting the peaks of that zigzag and keep an eye on market trends. It’s a great way to avoid rookie mistakes. New traders often stumble over fluctuations that are just market noise.
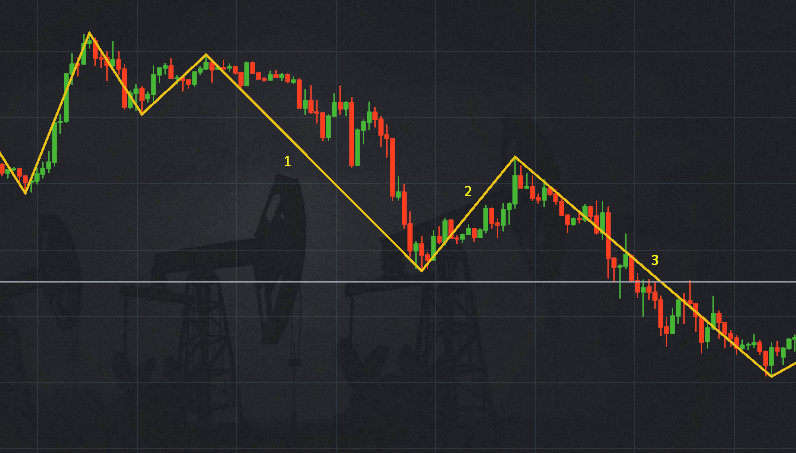
- Understanding the market's wave structure.
If you’ve done some trading, you’ve probably heard of Elliott Waves. Basically, a strong upward movement is usually made up of 5 waves, while a downward movement consists of 3 waves.
The Zig-Zag is my go-to for technical analysis. It clarifies trends way better than a straight line graph.
Honestly, the Zig-Zag indicator from Pocket Option trading platform offering unique strategies and resources isn’t a miracle tool, but it really helps in determining market direction and spotting reversals. Using it improves my efficiency. And as the Zig-Zag shows the position of each wave in the overall cycle, I can adjust percentage settings to get the best results. Every stock has its peculiarities, so I've got to tweak the Zig-Zag’s settings to fit those patterns.